Politics & Government
Metro Transit Ridership on Bus Routes, Trains Serving Fridley Tops 4M
Fridley trips on Northstar totaled 28,275 for the year.

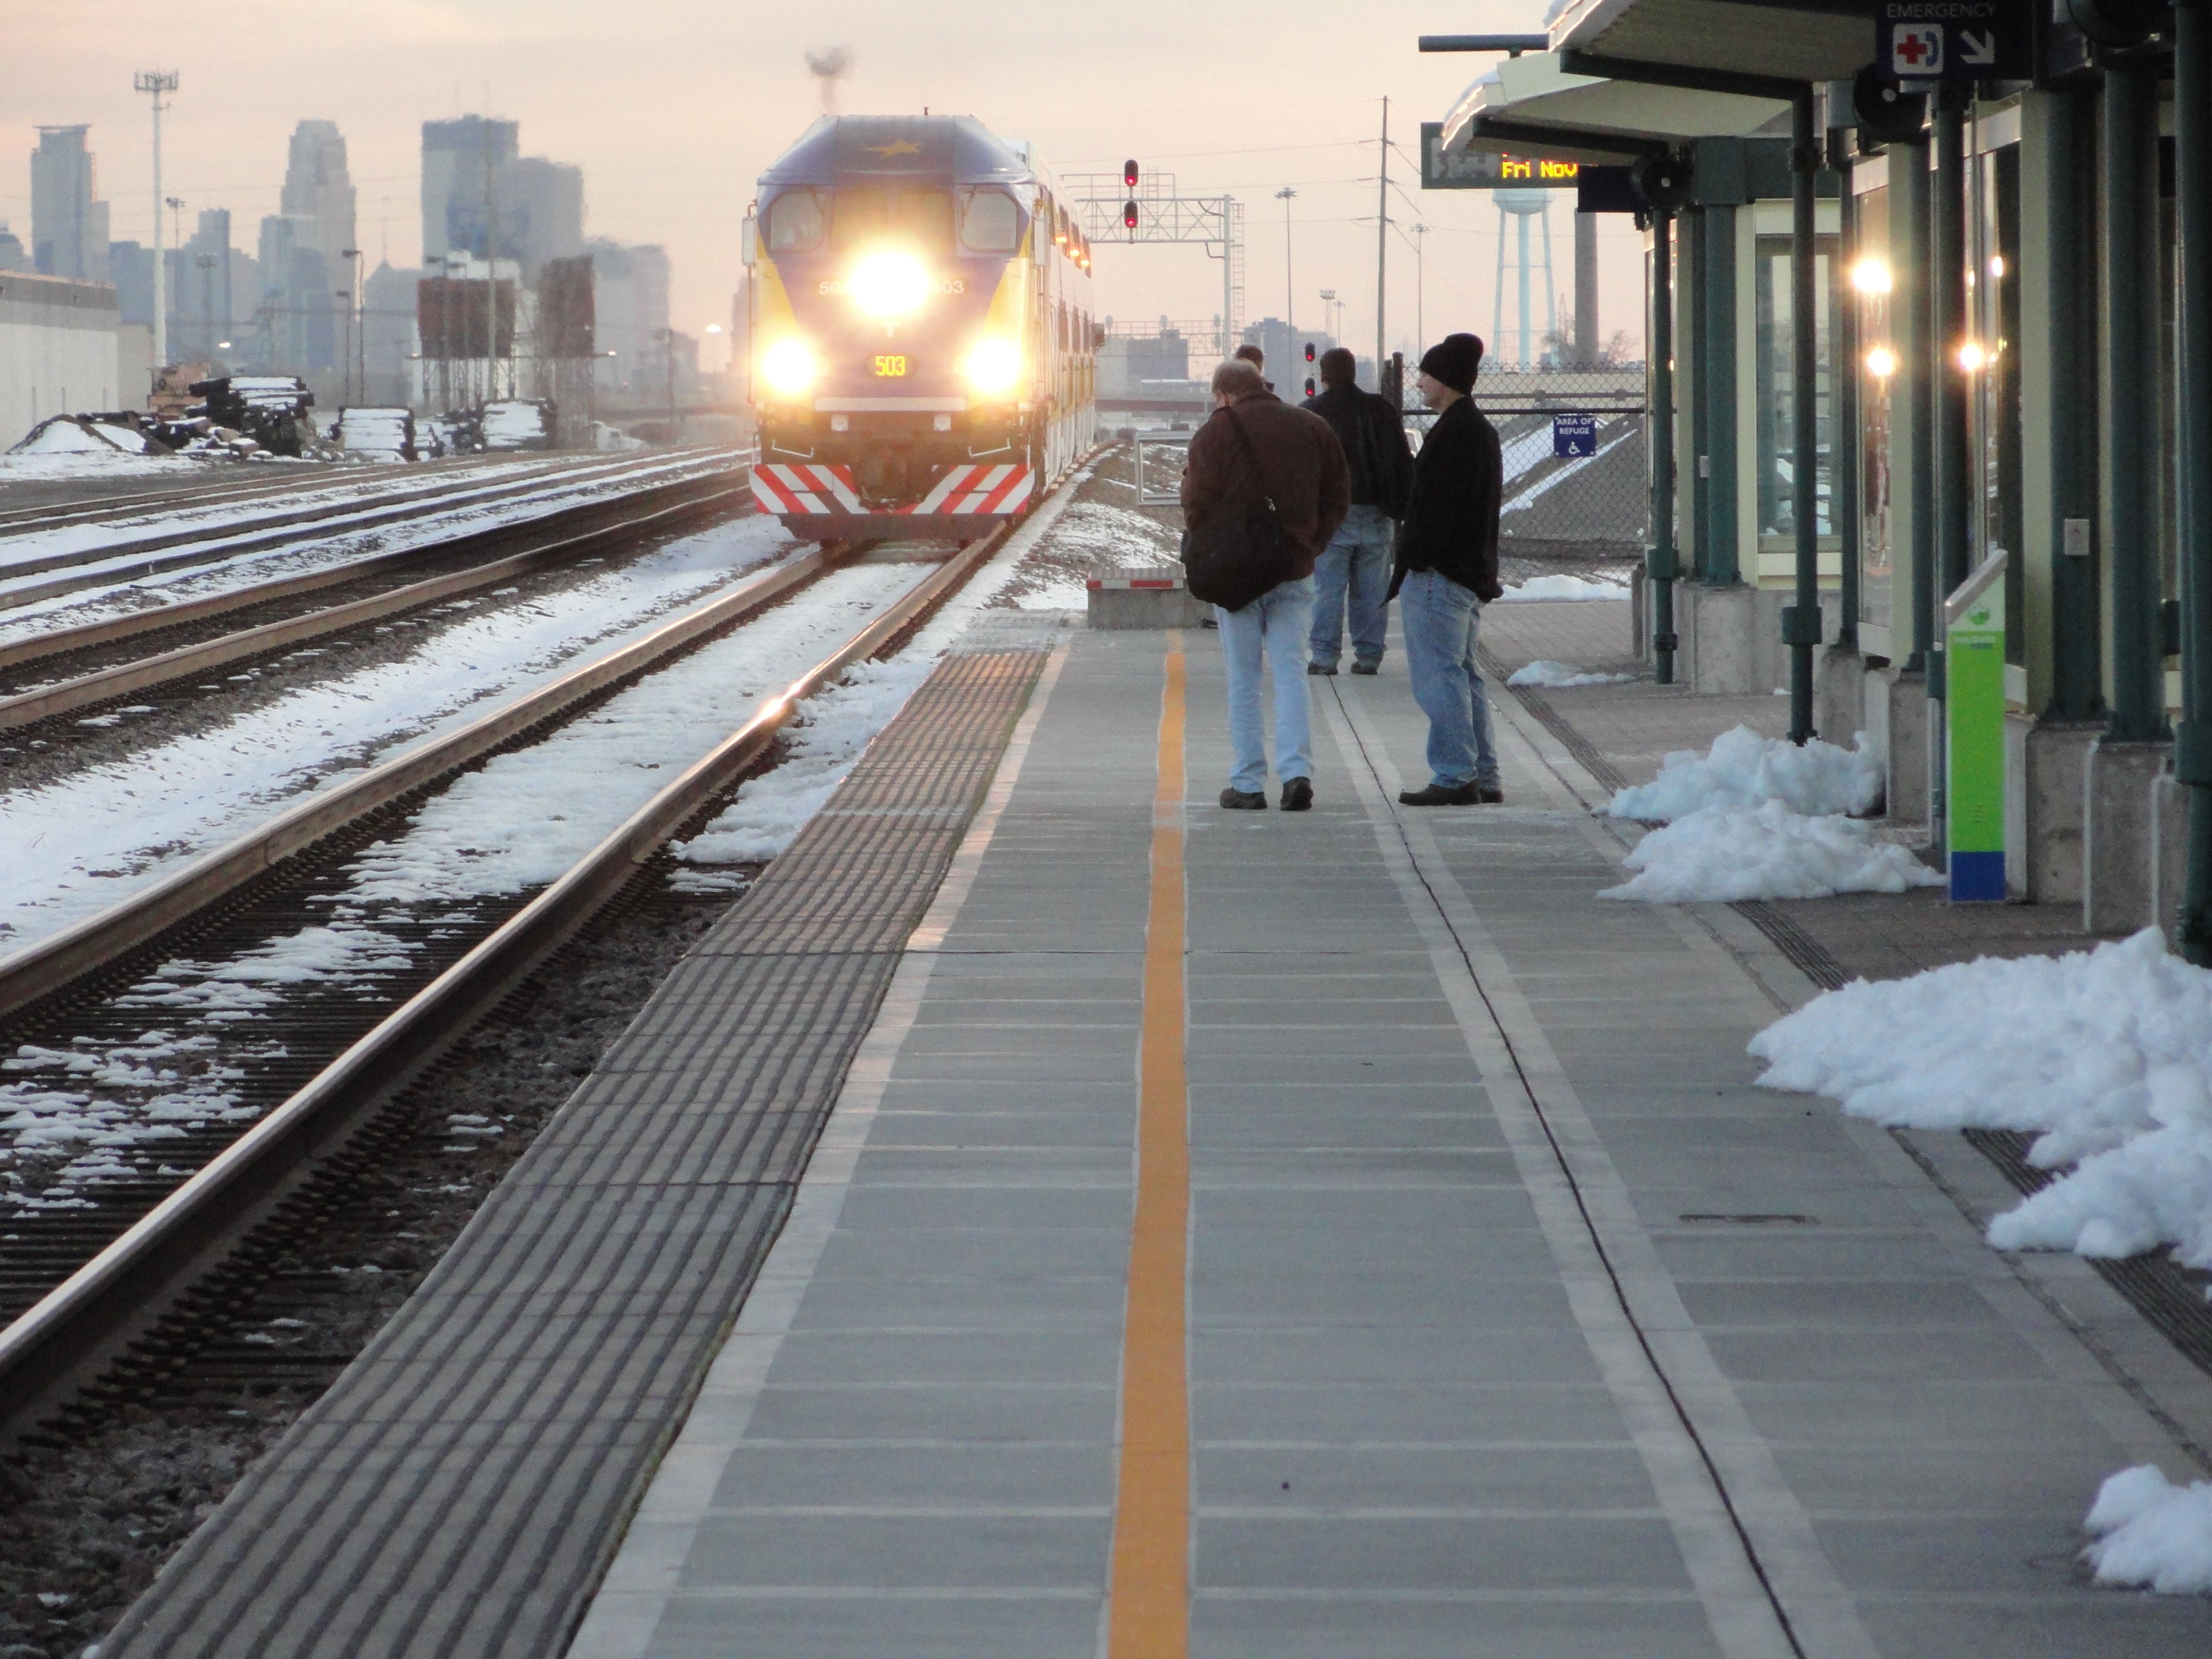
People took more than four million rides in 2011 on bus routes and the Northstar commuter rail line that serve Fridley, according to Metro Transit.
Overall Northstar ridership last year was down by 1 percent from 2010—primarily due to the freight-train derailment in Fridley that caused the line to in July 2011, the transit agency said in a press release.
Total ridership—including the Hiawatha Light Rail line—topped 80 million rides for only the second time in 30 years, General Manager Brian Lamb said, for a 3.5 percent increase over 2010.
Find out what's happening in Fridleywith free, real-time updates from Patch.
Here are the 2011 ridership figures for bus routes serving Fridley and the Northstar:
2011 Ridership for MetroTransit Bus Routes Serving Fridley
Find out what's happening in Fridleywith free, real-time updates from Patch.
*MetroTransit doesn't operate Route 801 and has yet to confirm these figures for that route.
2011 Ridership for Northstar Commuter Rail
Big Lake Elk River Anoka Coon Rapids Fridley Mpls*
Total Jan 6,607 7,391 4,787 4,695 1,452 22,339 47,271 Feb 6,377 7,063 4,467 4,323 1,421 20,545 44,196 Mar 8,031 8,718 5,444 5,263 1,640 25,488 54,584 Apr 9,741 9,139 6,341 6,486 3,012 31,078 65,797 May 9,241 8,932 6,086 6,299 2,929 30,056 63,543 Jun 10,902 10,017 6,650 7,007 3,286 34,496 72,358 Jul 9,131 7,830 5,380 5,842 2,969 29,377 60,529 Aug 12,546 10,457 7,064 7,136 3,831 37,865 78,899 Sep 10,019 8,898 6,174 6,138 2,821 30,828 64,878 Oct 7,912 7,250 5,090 4,581 1,653 24,360 50,846 Nov 7,191 6,790 4,813 4,408 1,551 21,984 46,737 Dec 9,022 7,532 5,184 5,082 1,710 25258 53,788 Total 106,720 100,017 67,480 67,260 28,275 333,674 703,426
*Ridership figures in this column tally people departing Minneapolis.
Get more local news delivered straight to your inbox. Sign up for free Patch newsletters and alerts.


