Politics & Government
MN Epidemiologist Runs the Numbers on Fridley's Cancer Rates
Minnesota Department of Health Epidemiologist John Soler dug through the state's statistics on Fridley's cancer rates in the last decade.

An email from John Soler, an epidemiologist at the Minnesota Department of Health, to a member of the in response to an email about Fridley's cancer rates:
You’ll recall last week I responded to an email you sent to Carl Herbrandson (Environmental Health - Minnesota Department of Health) where you expressed concern about the number of people you know who live in Fridley and have been diagnosed with cancer.
Since the Minnesota Cancer Surveillance System (MCSS) is able to provide you with statistics about cancer in your area, Carl and I thought this would be the best place to start.
A few words first about MCSS are in order. MCSS was established by the legislature and began collecting cancer data in 1988. 2009 is the most recent complete year although we have much of 2010 finished. MCSS collects all confirmed cancers except for the very common squamous and basal cell skin cancers. Audits have shown we are 99.99% complete. The data is collected according to national standards which all states follow.
Before I present the numbers, I’d like to say that it is certainly worrisome when one sees friends and neighbors being diagnosed with cancer. Not only is this a burden for the person with cancer and their immediate family, but those living in the same area often wonder if there is something in that area that may be the cause and that could be removed or mitigated to prevent future cancers. Although statistics are cold in and of themselves, we recognize that behind each statistic is a real person, often people we know or sometimes even ourselves.
Different cancers generally have different sets of risk factors or causes. The risk factors of lung cancer (tobacco use, radon, occupational exposures) are very different from the risk factors of breast cancer (reproductive history, exposures to estrogens, obesity/physical inactivity, and alcohol consumption) and so on with other types of cancer. Smoking is a strong risk factor for lung, oral/throat, bladder, pancreatic and kidney cancers but has little or no effect on colon, ovarian, prostate or thyroid cancers. Obesity is a clear risk factor for kidney, pancreatic and breast cancer but not at all for lung or stomach cancer. Therefore it is important to look at the types of cancer that one sees in an area – not just the overall number. Race, gender and age are important determinants of cancer rates.
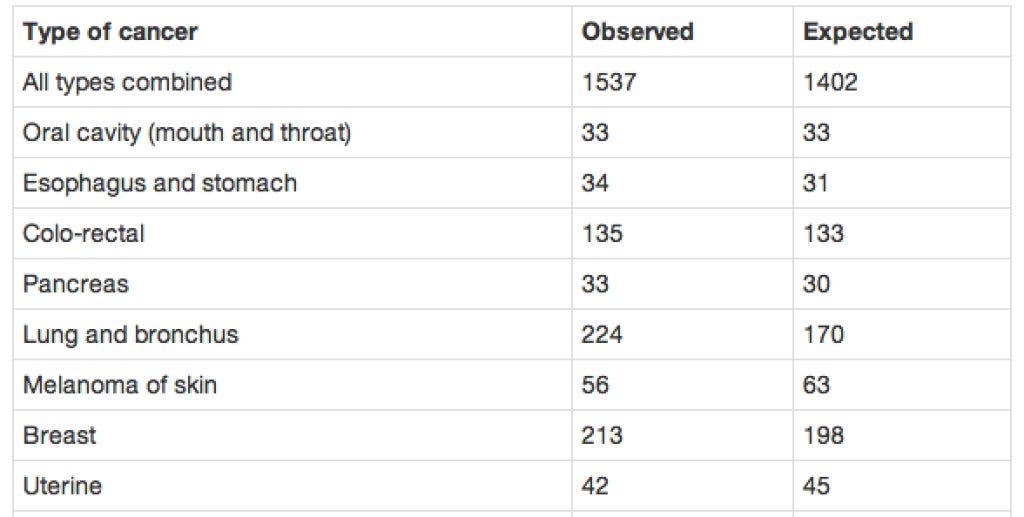
I will present the numbers as number of “observed” and “expected”. Number of observed is obviously how many cancers were diagnosed in residents of Fridley (in this case) during the time period in question. Number of expected is how many cancers would have been expected in Fridley residents if the cancer rates for Fridley were exactly the same as the rates for the state of Minnesota as a whole. If the observed number is greater than the expected number, then the rate is higher than the state rate. If the observed number is less than the expected number, then the rate is lower than the state rate. I should also note (for those into the technical side of this) I’ve used the census tracts of 511.01-02-03, 512.01-02-03-06 which is basically the city of Fridley. I’ve attached a map of these 7 census tracts.
These numbers will tell you how many cancers have occurred in residents of Fridley and so addresses your original question about your impression of many neighbors with cancer. It will tell you whether this is above or below the state average. The address collected by MCSS (and all cancer registries) is the address at the date of diagnosis of the cancer. Because Americans move frequently, and because the latency period for most cancers are decades these numbers are of little use for determining whether there is or is not environmental issues that are causing disease. There are numerous examples of highly polluted areas with “normal” cancer rates (Love Canal) and likewise examples of high cancer rates where there are no apparent pollution issues. I might also note that given today’s cancer numbers, if nothing were to change, about 50% of Minnesotans will at some point be diagnosed with cancer. As we live longer (Minnesotans have one of the longest life spans in the 50 states) we have more chance to have a cancer diagnosis.
As you can see, the number of total cancers (1537) is about +10% higher than would be expected if cancer rates in Fridley were like that of Minnesota. Lung cancer (224) jumps out at +30% higher than expected and accounts for a considerable portion of the overall excess. This lung cancer elevation is true for males and females but is especially high in females (+48%). Lung cancer is typically associated with smoking history and past occupational exposures particularly for men. Bladder cancer (+16%), non-Hodgkin lymphoma (+14%) and breast cancer (+8%) are higher than the state average. You can see that some of the cancer sites are below the expected number, some above, and quite a few are at the expected number. This is very typical of zip codes. (These seven census tracts approximate 55432.) While +10% is higher than the state average, I will note that 10% (in either direction) is not particularly unusual given the high lung cancer excess.
You can see with the past ten years of data, that each year, one would expect about 140 cancers; there have actually been about 154 each year. That number jumps around in any given year from a low in 2005 of 138 to a high in 2008 of 181. (2009 had a total of 154).
I might also add as a caution, that the expected number is based on the population size and age for each of the years (2000-2009). This is based on the census of 2000 and 2010. It assumes no under (or over) counting for the area. This may or may not be the case. Also, since we don’t know exact populations for the non-census years, those are estimated and estimates may be inaccurate. If there was more rapid growth/decline in the early or late part of the 2000s, then the expected number could be off.
This is a lot of information to digest so certainly if you have any questions about the data or anything I’ve said please feel free to contact me.
Keep up with this issue by signing up for the Fridley Patch newsletter.
Number of Incidents of Cancer in Fridley between 2000 and 2009
(Expected figures are based on state-wide averages.)
Find out what's happening in Fridleywith free, real-time updates from Patch.
See also:
Find out what's happening in Fridleywith free, real-time updates from Patch.
Get more local news delivered straight to your inbox. Sign up for free Patch newsletters and alerts.


